Lorax: A Tool to Explore Genetic Ancestry.
When people talk about family trees in genetics, they usually mean phylogenetic trees — simple branching diagrams that show how species or individuals are related. Those are useful, but they miss something important: recombination.
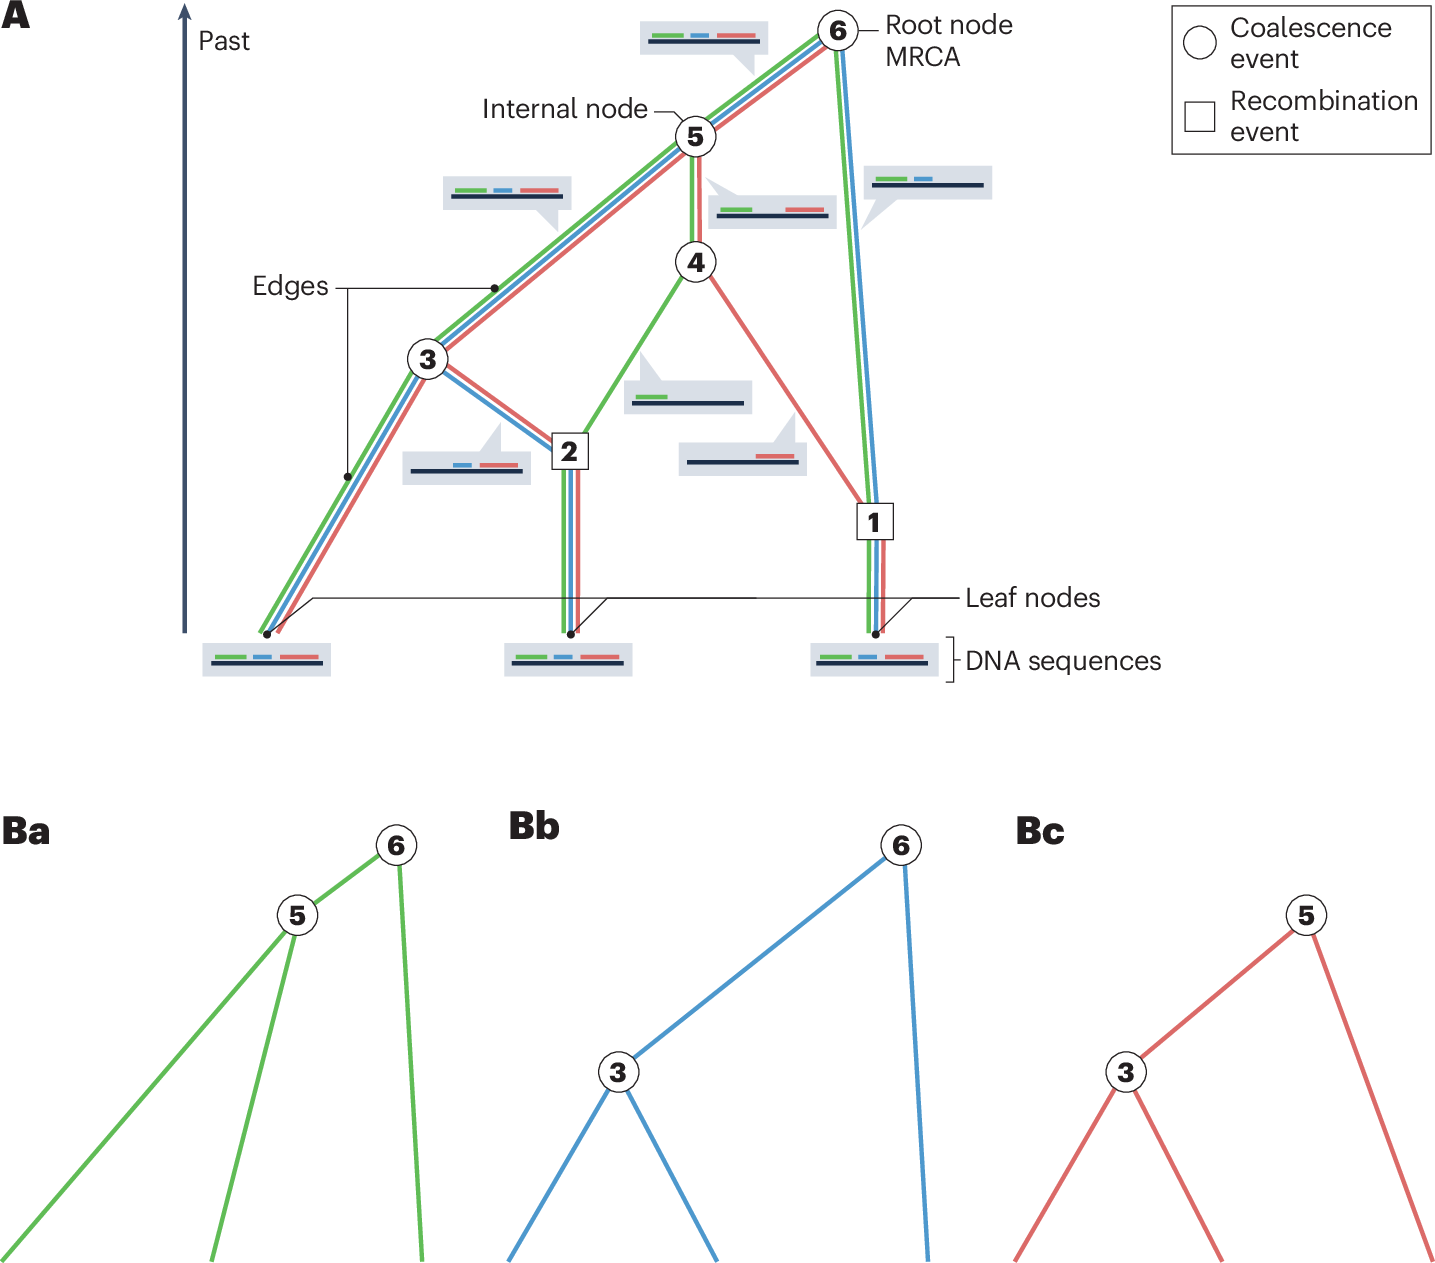
DNA doesn’t just get copied and passed down in tidy branches. Segments shuffle, swap, and recombine. That means if we want the full picture of how our genomes have been inherited, we need something more complex than a tree. That’s where Ancestral Recombination Graphs (ARGs) come in.
An ARG is like a blueprint of genetic history. It doesn’t just say “these two lineages merged here,” it also keeps track of the places where DNA was exchanged. In other words, ARGs can show not just who our ancestors were, but also how the pieces of their DNA got mixed together and passed down over time.
Why ARGs are important
ARGs are powerful because they let us study human history at a much deeper level. With them, we can see how our species has evolved over time, understand population histories and migrations, explore connections between ancestry and health, and even spot recombination hotspots and patterns that a plain tree would miss. In short, ARGs give us a richer, more realistic view of evolution.
In short, ARGs give us a richer, more realistic view of evolution.
Lorax — making ARGs interactive
The problem is: ARGs are really hard to work with. They’re massive, complicated graphs that don’t fit neatly on a page. For a long time, most people in biology just couldn’t explore them without writing custom code.
That’s why I’ve been working on Lorax. It’s a web app that makes ARGs interactive. Instead of staring at a static figure, you can pan, zoom, and explore genetic ancestry like you would with a map.
Lorax is built to help you:- Browse whole-genome tree sequences in your browser.
- Watch how ancestry changes across recombination breakpoints.
- Get both the “big picture” and the fine detail, depending on what you’re curious about.
- Even ask questions about the data with AI assistance (still experimental, but fun).
Looking ahead
My hope with Lorax is simple: to make ARGs less mysterious. These graphs hold an incredible amount of information, but until now they’ve been locked away in theory papers and hard-to-use code. By putting them into an explorable, visual form, we can start using ARGs to tell the real stories of how our genomes came to be.
Because sometimes to understand evolution, you need to see not just the trees… but the whole forest. 🌲